When less is more: Exploring the relation between delay discounting rates in a personal and organizational context

For ABA clinicians, supervisors, and clinic leaders, this post explains how delay discounting influences staff choices about workplace resources and long-term initiatives. It helps turn ABA data into clear, ethical decisions about designing incentives, supervision, and systems that reduce delay and increase certainty so promised benefits function as real reinforcers. Practical steps include assessing organizational follow-through, using nearer-term contingencies, and tailoring supports without labeling staff.
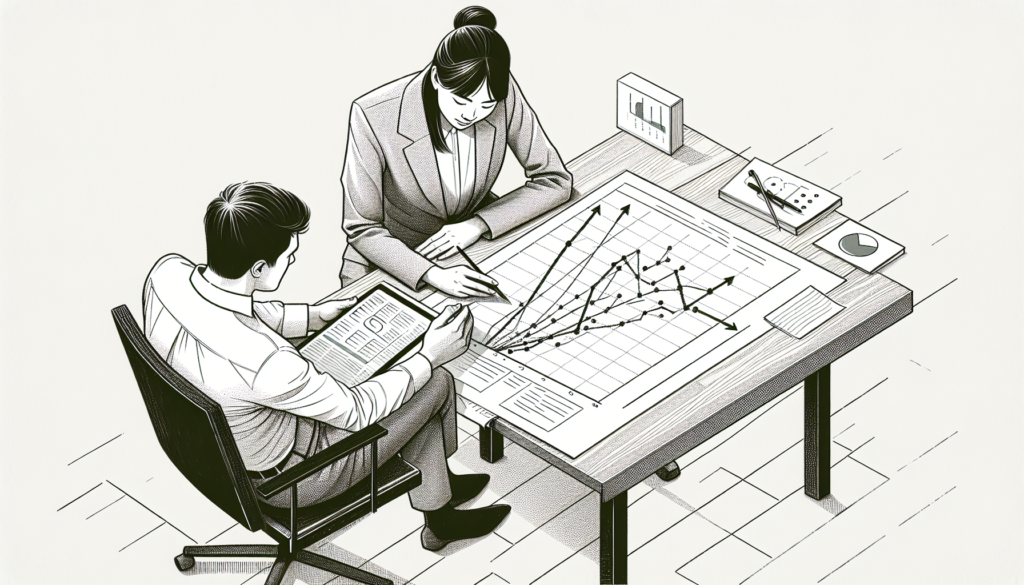
Data Visualization in ABA: Graphs, Dashboards & Templates

Free ABA data visualization templates and dashboards: line graphs, bar graphs, cumulative records, and decision-making frameworks BCBAs actually use.
Data Visualization & Analytics in ABA: Graphs, Dashboards, and Decision-Making That Works: Real-World Examples and Case Applications

This post is for behavior analysts, clinicians, and ABA teams seeking practical guidance on turning data into actionable practice. It demonstrates how graphs and dashboards support transparent, ethical decision-making about treatment effectiveness and progress. With real-world examples and case applications, it helps you translate ABA data into clear, defensible decisions for clients and stakeholders.
ABA Graphs: Common Mistakes & How to Avoid Them
The most common ABA graphing mistakes BCBAs make — scaling, condition lines, ordinate range — and how to fix them. Free templates and CEUs.
Data Visualization & Analytics in ABA: Graphs, Dashboards, and Decision-Making That Works

This post is for behavior analysts, clinicians, and students who collect ABA data and want clearer, ethically sound decisions. It shows how graphs, dashboards, and analytics can translate raw data into actionable insights for progress monitoring and decision-making. With a practical, clinician-friendly focus, it demonstrates how visualization supports transparent, client-centered practice.