The Most Common Type of Graph in ABA
Mar 17, 2025
The Most Common Type of Graph in ABA

The Basics of Line Graphs
Definition and Structure
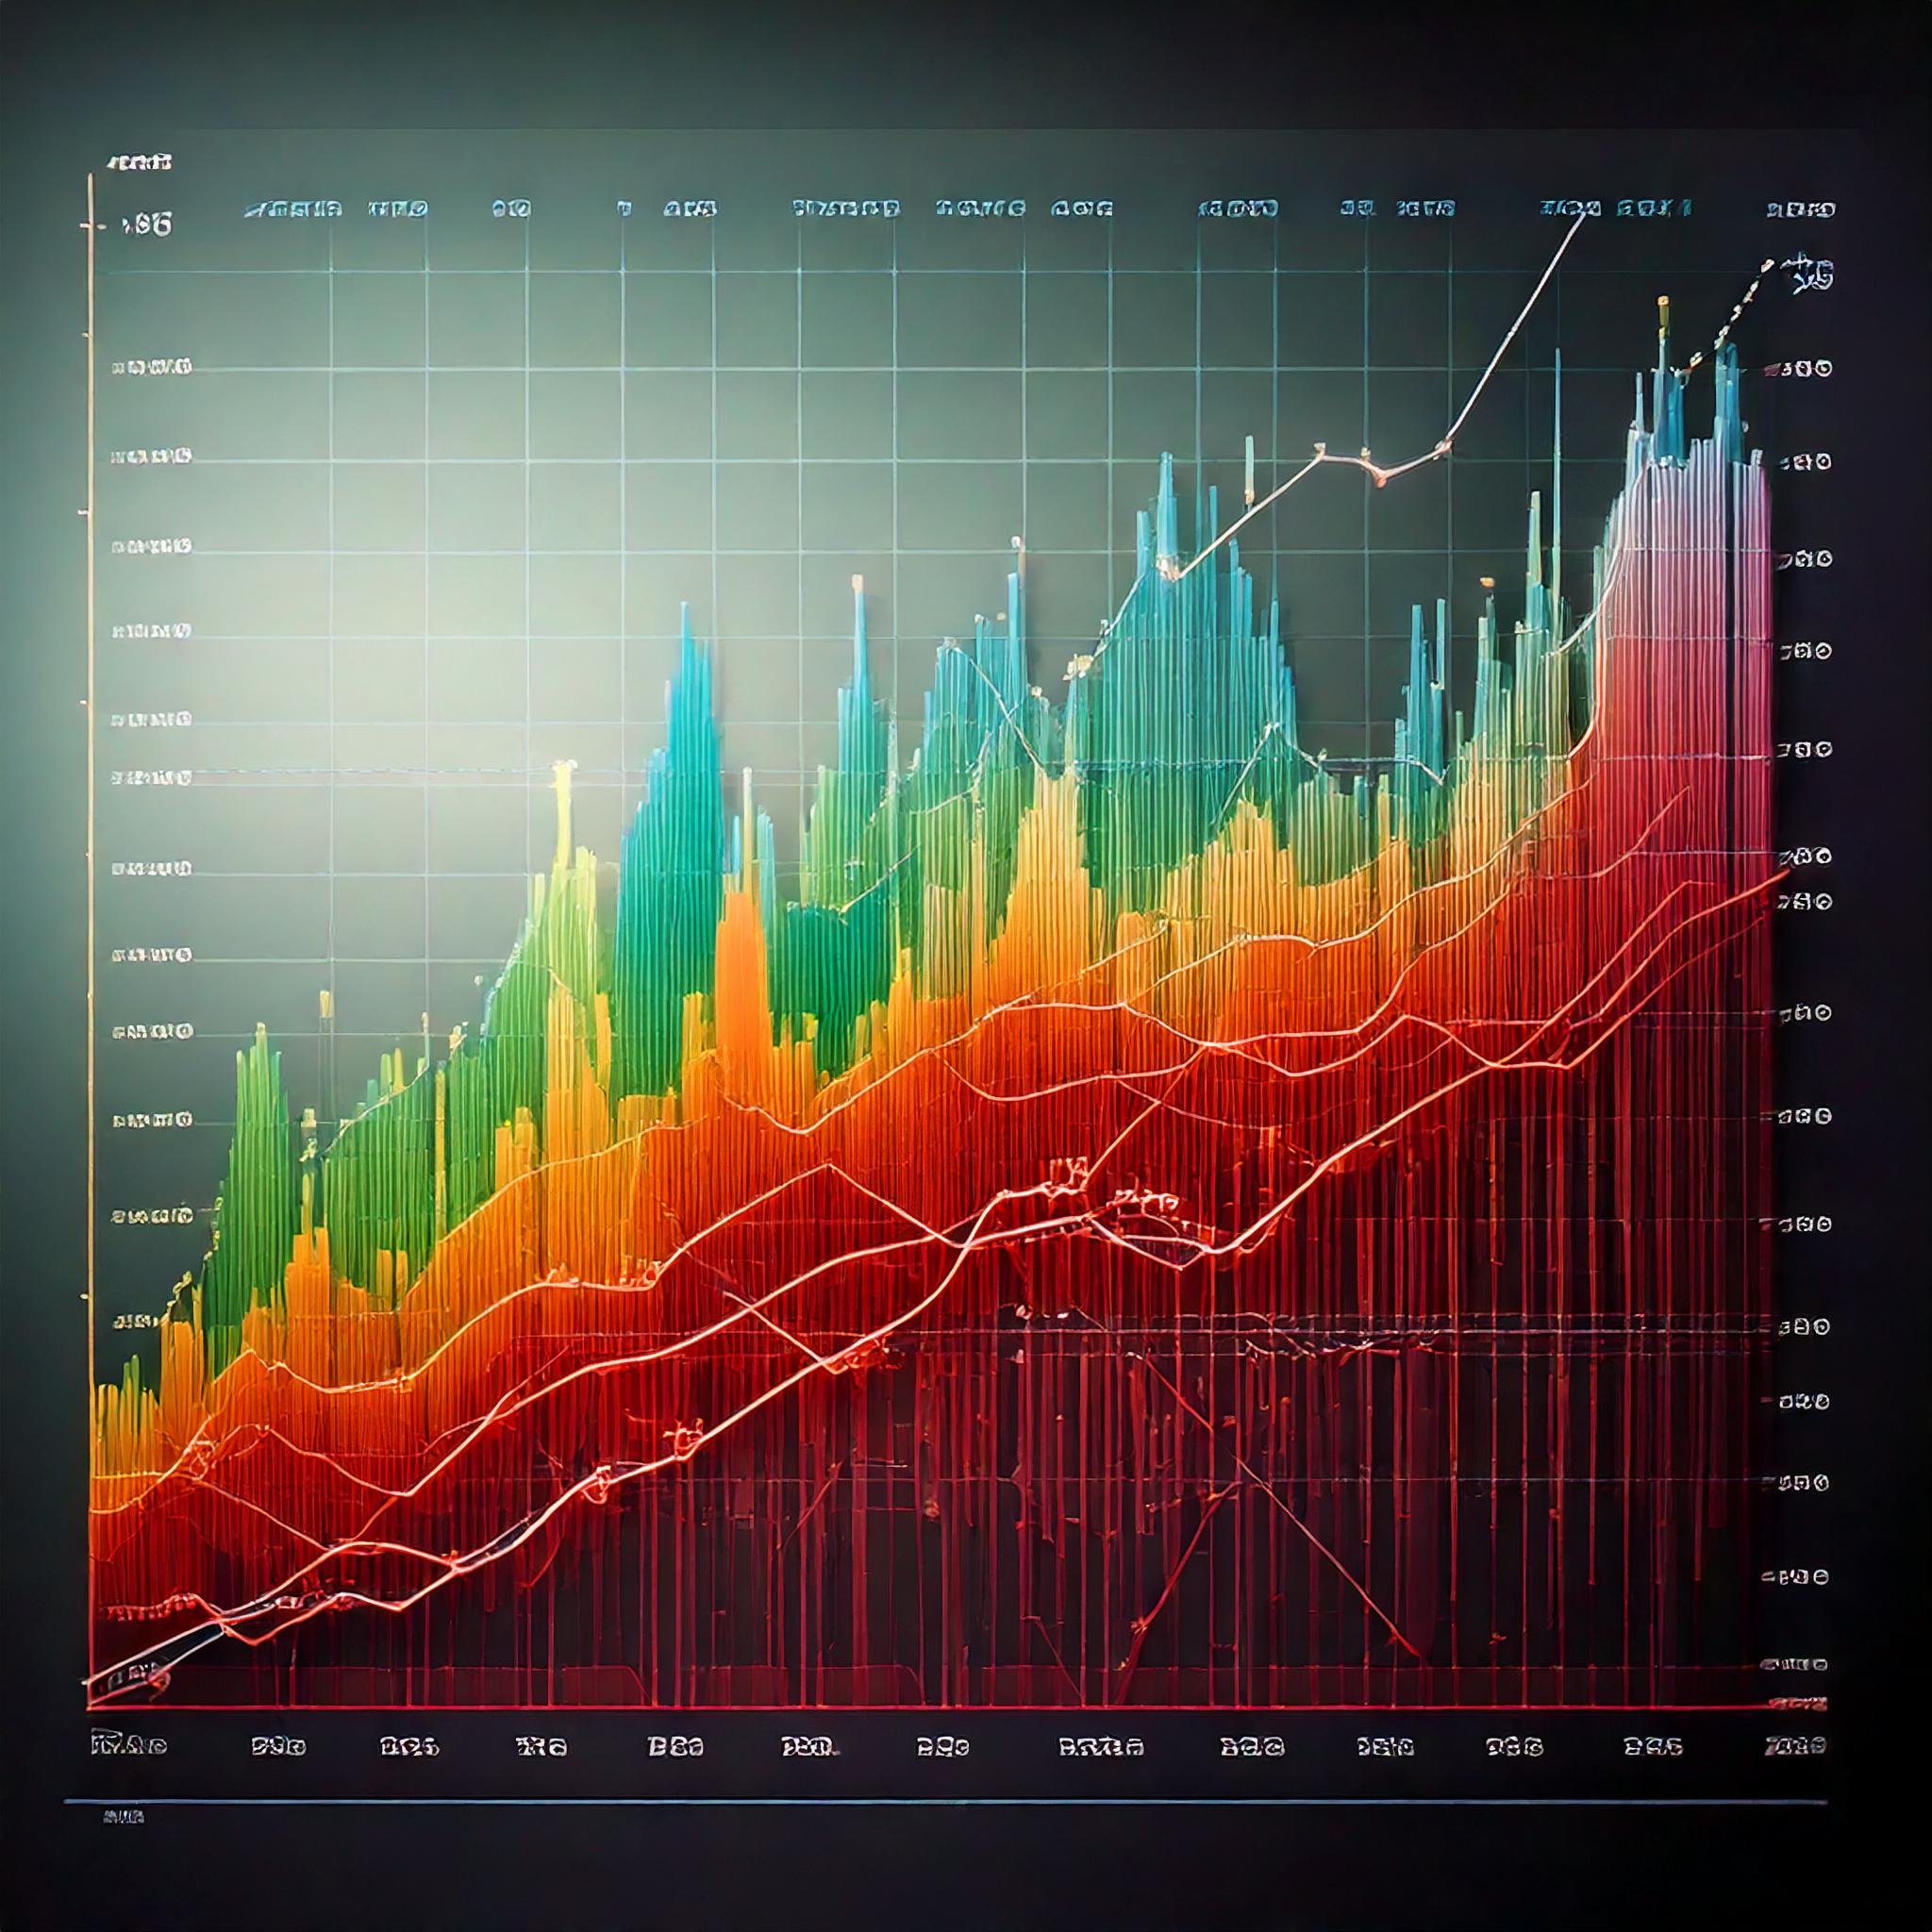
In Applied Behavior Analysis (ABA), data visualization is critical for tracking behavior change over time. The most common type of graph used in ABA is the line graph. A line graph is a graphical representation in which data points are plotted along the x-axis (independent variable) and y-axis (dependent variable) and connected by a straight line to illustrate trends over time.
Key Components
A line graph in ABA consists of several essential elements:
-
X-axis (Horizontal Axis): Represents the observation period or sessions.
-
Y-axis (Vertical Axis): Depicts the dependent variable, such as the number of responses or frequency data of a specific behavior.
-
Data Points: Each point represents collected data for a given session.
-
Trend Line: A visual representation connecting data points that helps in data analysis.
-
Phase Change Line: Also known as a condition change line, it marks shifts in different conditions during therapy.
-
Condition Labels: Descriptions of interventions or behavior modification strategies applied at different phases.
When to Use Line Graphs
Line graphs are ideal for:
-
Tracking behavioral changes over time.
-
Comparing different conditions in therapy sessions.
-
Assessing the effectiveness of interventions.
-
Conducting visual analysis to determine trends in collected data.
How to Create a Line Graph

Collecting Data
ABA therapists collect personal data on the target behavior during a specified observation period. They systematically record the total number of responses, duration, or intensity of behavior.
Plotting Data Points
Each session's data is plotted as a data point on the graph, aligning with the respective x-axis and y-axis values.
Connecting Data Points
A trend line is drawn to connect data points, visually depicting progress, regressions, or stability in behavior change.
Interpreting Line Graphs
Understanding Trends
A trend line helps identify increases, decreases, or stable patterns in behavior. The overall direction of the line provides insights into the intervention's effectiveness.
Identifying Patterns
Patterns in ABA graphs reveal critical information about behavior modification strategies. Repeated spikes or dips might indicate external influences or ineffective interventions.
Making Data-Based Decisions
ABA professionals make data-driven decisions to adjust interventions based on the graphs they use. Identifying when to modify, maintain, or discontinue treatment is key to effective therapy.
Other Types of Graphs Used in ABA
Bar Graphs
A bar graph (or Bar Chart) is another type of graph used to compare behaviors across different groups or conditions. Unlike line graphs, bars represent total numbers rather than trends over time.
Cumulative Record Graphs
A cumulative graph plots the total number of responses over time, showing a continuously increasing trend. This type of semilogarithmic chart is often used to measure response rates and track long-term behavior trends.
Scatterplots
A scatterplot visualizes relationships between two variables. It helps identify relevant quantitative relations and patterns in behavioral changes that may not be evident in line graphs.
Advantages of Line Graphs in ABA
Clarity and Simplicity
Line graphs provide a clear visual representation of collected data, making them easy to interpret for therapists, caregivers, and clients.
Versatility
They can display various data types, from frequency data to correct answers in educational settings.
Real-Time Data Monitoring
ABA practitioners can monitor changes in behavior as they occur, allowing for timely intervention adjustments.
Common Mistakes to Avoid
Mislabeling Axes
Failing to accurately label the horizontal (time) and vertical (behavior) axes can lead to misinterpretation.
Inaccurate Data Plotting
Errors in plotting data points compromise the reliability of the graph.
Ignoring Data Trends
Failing to analyze trend lines can lead to ineffective interventions or missed opportunities for adjustment.
Conclusion
Summary of Key Points
-
The most common type of graph in ABA is the line graph.
-
It is crucial for data visualization and monitoring behavioral changes.
-
Understanding graph uses helps in making data-driven decisions.
Final Thoughts on Using Line Graphs in ABA
ABA professionals must adhere to best practices in data analysis to ensure accurate, meaningful insights for therapy and research.
Additional Resources
Books on ABA Data Collection
-
Behavior Analysis for Lasting Change – A textbook covering best practices in ABA.
-
Graphing Behavior for ABA Practitioners – A guide on different types of ABA graphs.
Online Courses for ABA Practitioners
-
Behavior Analyst Certification Board (BACB) approved courses on visual analysis.
-
Study guides on data-driven decisions and graphical representation.
Software Tools for Creating ABA Graphs
-
Microsoft Excel and Google Sheets for basic graphing.
-
Specialized ABA software for generating non-equal interval graphs, logarithmic scales, and phase lines.
Solve your clinical challenges with research using this simple, 3 step process that saves you time and gets you clinical answers FAST.
Learn the Key Places Framework, the Research Finding Framework, and how they work together in this free minicourse.
Signing up will also subscribe you to the email list. Unsubscribe at anytime! We will never sell your information, for any reason.

